Facebook
 X
X
 Pinterest
 Copy Link
Is the Current Surge in Available Homes Fact or Fiction?

Whether you are considering a move or just staying informed about the housing market, having the latest information is crucial. With all the latest headlines you might find yourself wondering, “is the current surge in available homes fact or fiction?” Let us help provide you some insight, follow along for a current update on the supply of homes for sale in your area. Whether you are in the market to buy or sell, the available inventory plays a significant role. Dive into the details below for insights.
The Truth About Today’s Housing Inventory:
The narrative the past few years has been centered around the scarcity of homes on the market. However, recent national data demonstrates a twist to the story that if your like most might have you questioning the truth. According to Realtor.com, inventory is showing signs of growth month-over-month in numerous regions across the country (highlighted in blue on the map below).
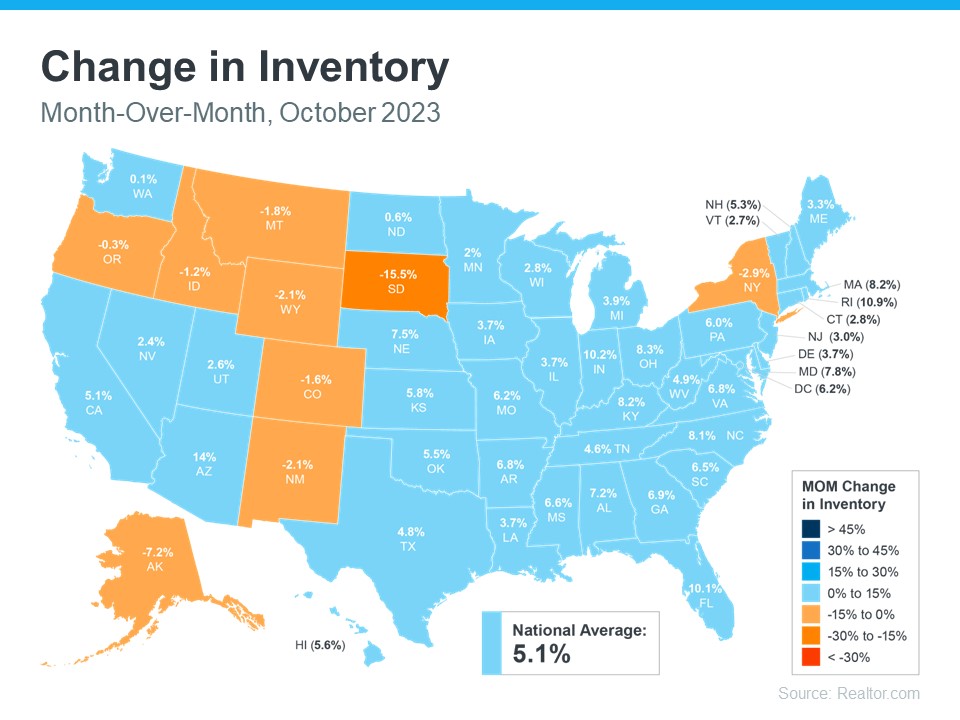
Looking at the map, nationally, the housing supply has increased just over 5% last month alone.
Does This Mean the Days of Limited Housing Inventory is Over?
Many people are wondering if the days of limited housing supply is behind us. This is a fantastic question. The short answer is no. Understanding the full picture here is important. Headlines are stating that inventory is up. The statement is true when compared to the most recent market, but when you look further back, data shows that there are still significantly less homes for sale now than typically listed in a more normal market.
Let’s discuss the graph below.
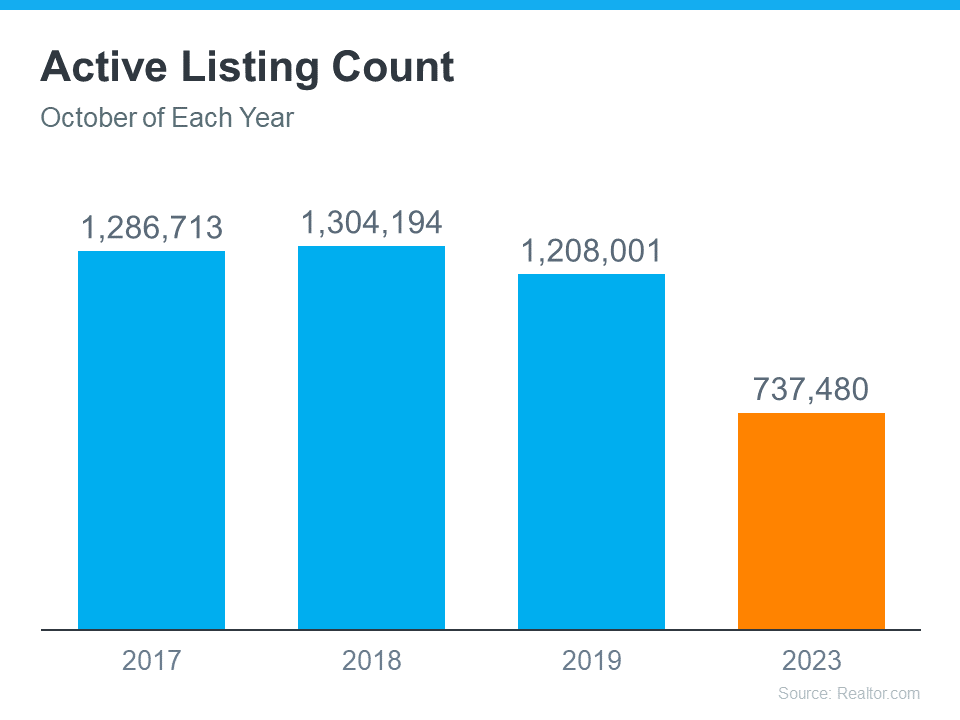
This graph demonstrates homes listed for sale during the month of October for the three most recent normal years compared to homes listed in the month of October in 2023. As you can see there are significantly less homes listed in 2023 than in that of a normal market. Viewing this helps explain comments like the one ResiClub Analytics, founder, Lance Lambert made where he said, “Housing market inventory is so far below pre-pandemic levels that October’s big jump is still just a drop in the bucket.”
At the end of the day, real estate is hyper-local and changes vastly between locations. It is of the utmost importance, especially in times like these, to look to your trusted real estate agent for clarification of the market as they will help you gain better understanding of the inventory situations in your specific market. Don’t have an agent? Connect with us here.
If You Are Looking to Buy:
You might discover more options than you have in the most recent months. However, it would behoove you to prepare yourself for low inventory. Find yourself a great agent that will share their expertise and strategies that have helped others navigate today’s ongoing low housing.
If You Are Looking to Sell:
Know that you have not missed your window of opportunity to potentially get multiple offers or see your house sell quickly. While inventory has picked up some nationally, overall, it is still low. Having a professional Realtor on your side can help you significantly in understanding the market you are in. A great agent can craft your home a unique marketing plan that meets the requirements of the market to get your home sold.
Regardless of weather you are looking to buy or sell a home, let’s connect so that you are up to date on all of the latest trends that could potentially impact your move.
Low Housing Inventory Explained
If you are considering moving in today’s market, you are probably wondering why it is so hard to find a house to buy. The lack of inventory might leave you feeling a bit defeated and likely on the verge of giving up and waiting to try again when there are more options. But… that is NOT the best idea. Let us explain why.
The lack of inventory we are experiencing has been a problem for years and is likely to continue for quite some time. Follow along as we expose some of the long-term and short-term factors that contributed to the limited supply we are feeling in our housing inventory.
Shortage of New Construction
Changes in our economy and other contributing factors have slowed the rate at which builders are building new construction. For more than a decade, new construction has been below the national average. Consider the graph below. It demonstrates the past 5 decades of new construction of single-family homes.
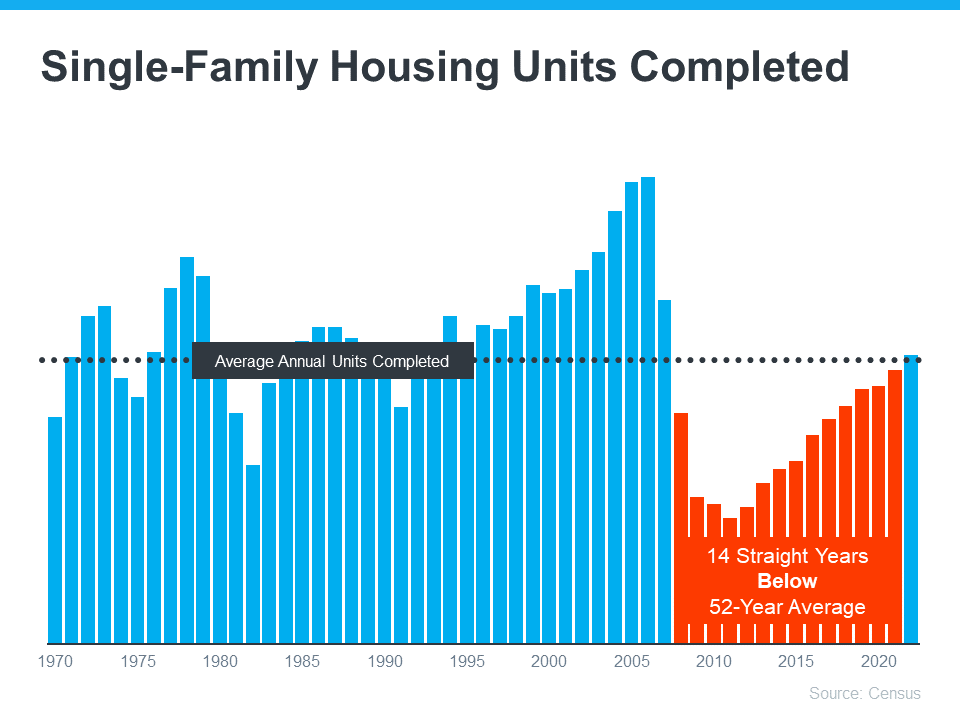
Looking at the chart, the orange shows that builders did not construct enough homes to meet the historical average for the past 14 years. Underbuilding significantly contributed to the inventory deficit and will take a lot of work to get the housing market back to where it once was. While the graph shows improvement this last year, the long-term inventory shortage will not snap back overnight.
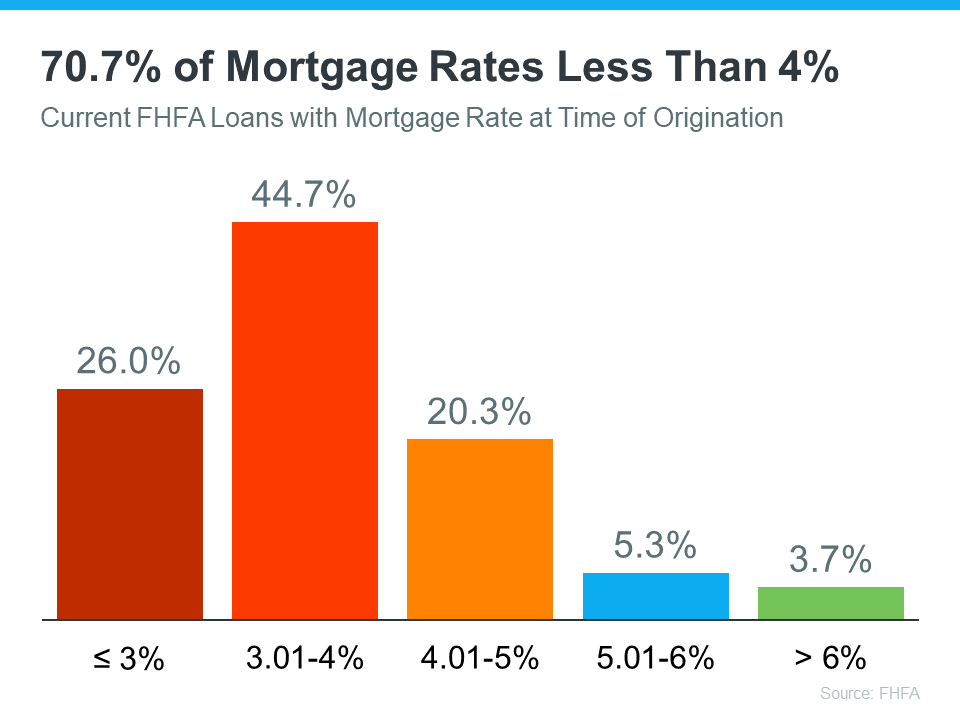
Owners are Locked in at Low Rates
Several factors of today have created stumbling blocks for returning to a healthy market. One of the most obvious challenges is the mortgage rate lock-in effect. You might be wondering what the mortgage rate lock-effect is. We are here to explain. When mortgage rates were at all time lows, home owners locked in at incredibly low rates making their monthly house payments significantly less each month than what someone buying a home with todays rates would be. Many owners are hesitant to sell because mortgage rates are higher today. Homeowners don’t want to take on the higher mortgage rates and loose their low mortgage rate. The image below demonstrates how many homeowners are finding themselves in this predicament.
Homeowners are faced between low mortgage rates and their needs. Many are sacrificing their needs to keep their low interest rates. What homeowners need to keep in mind is that their needs may be just as important as the financial aspects of their move. A difficult predicament for sure. If you have found yourself faced with this situation and would like to schedule a personalized review of your unique situation and what options you might have available to you connect with us here.
Media Creates Unnecessary Fear
Have you ever heard the saying, “Don’t believe everything you read, see, or hear.” This statement couldn’t be more true. Media has fabricated fear surrounding the housing market that has people fearful of making any move and unsure of what to believe. You probably have been bombarded with headlines promising a housing crash or that home prices will fall by 20%, yet neither of those things came true. Regardless, the stories blemished your confidence just enough to keep you holding off just a little bit longer. Co-Founder and Chief Data Officer of Parcl, Jason Lewris articulated it perfectly saying:
“In the absence of trustworthy, up-to-date information, real estate decisions are increasingly being driven by fear, uncertainty, and doubt.”
This increasing fear leads to decreasing housing inventory because people who would otherwise make a move are now hesitant to do so. The market is not doom and gloom though. Even if the headlines say that they are. Our realtors can help you decipher the facts from the fiction and help identify opportunities in your unique situation. If you are not currently working with an agent and would like to be connected with one, connect with us here.
Why This Should Matter to You
You might be wondering why any of this matters to you. The answer differs for both buyers and sellers and can vary depending on your personal situation. Talking with an agent is the best thing you can do. However, we will offer you an overview.
If you are a buyer:
Due to the limited number of homes available on the market you will need to seriously consider all of your options. Keep an open mind to different locations and housing types. A skilled professional will help you explore all of your options and what is available to you to help you find the home that best fits your needs. If you are not currently working with an agent and would like to be connected with one of our trusted realtors click here. Our agents will help expand your search and determine a solution that best fits your needs.
If you are a seller:
This market actually benefits you more than you might realize. The low housing inventory means that your home wont get lost amongst the other homes. Your home will stand out in this market. Connect with your agent to discover why it is especially worth your while to sell in todays housing conditions.
At the end of the day, low housing supply is not a new challenge. Both long-term and short-term factors have contributed to the inventory deficit we are experiencing. If you are considering making a move, let’s talk. Regardless of whether or not you decide to buy or sell you have an expert on your side and will have made an educated decision best for you.

We are NOT in a Housing Bubble: Here’s Why!
Home buyers are beginning to believe we are heading into a housing bubble. It is easy to acknowledge this premonition, as year-after-year home price appreciation has continued to remain in the double digits.
However, we are here to put your mind at ease as this market is very different than it was during the housing crash 15 years ago. Follow along as we explain four fundamental reasons why today's market is nothing like the market was back then.
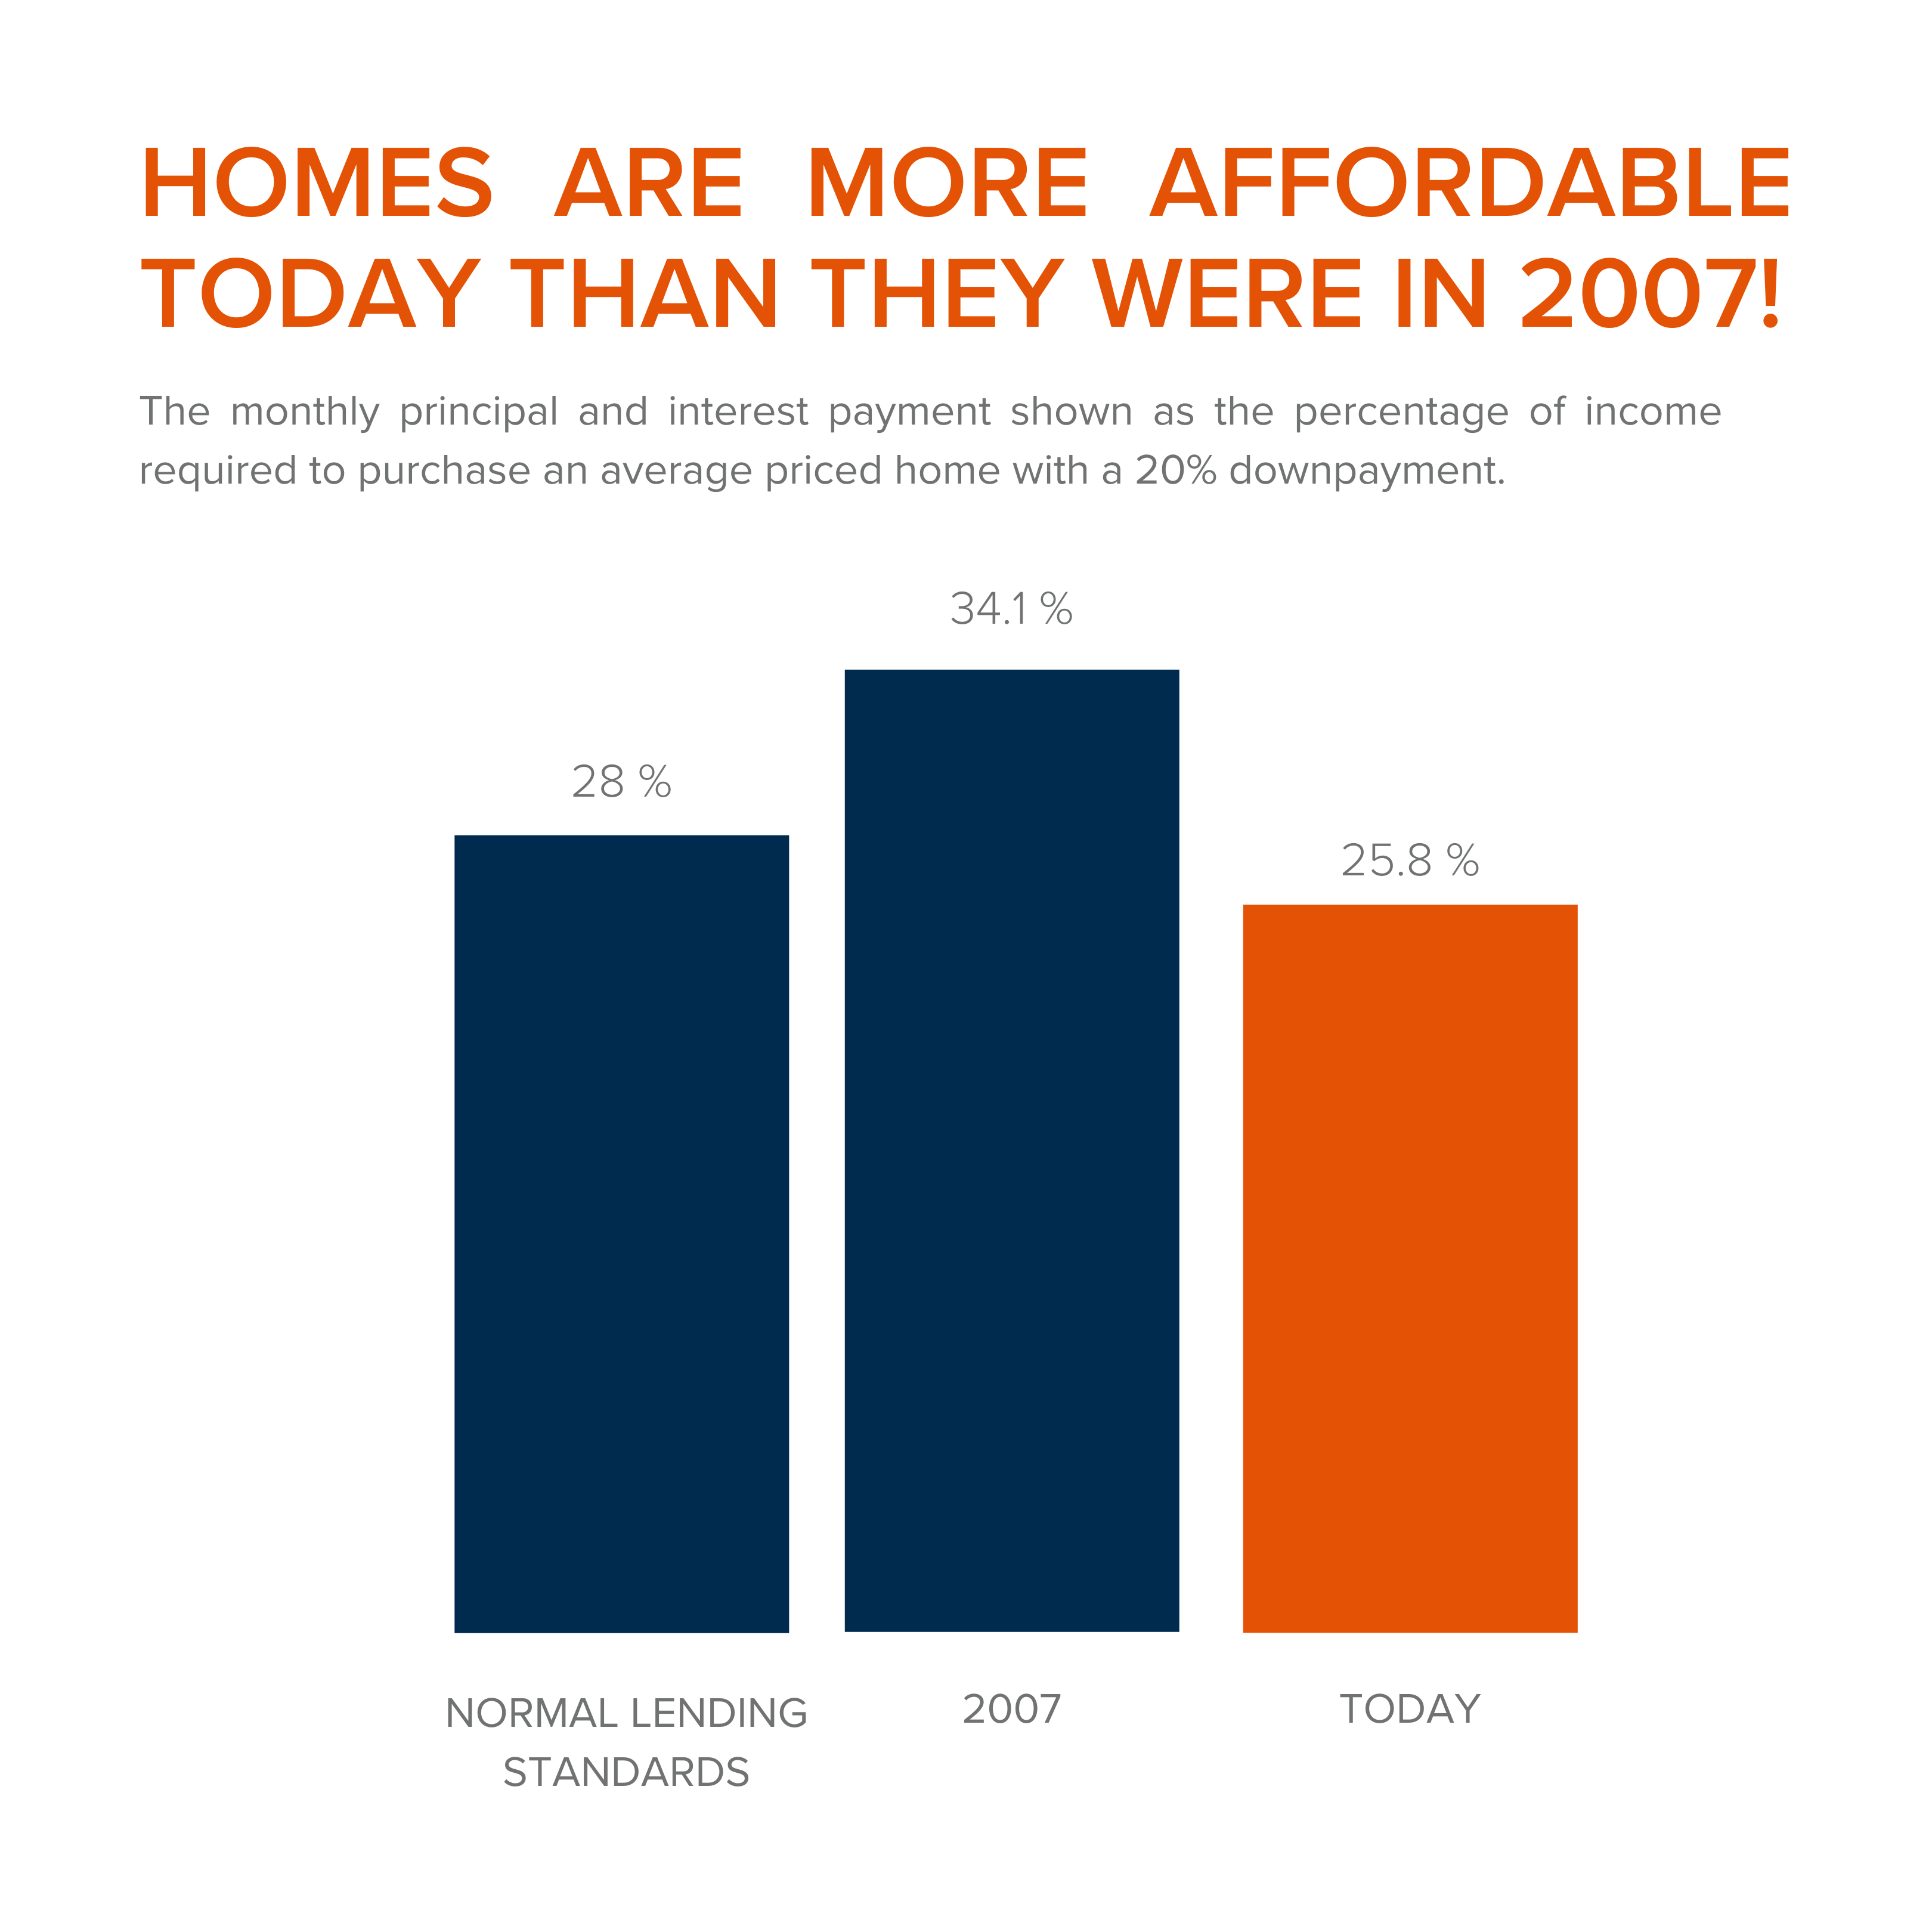
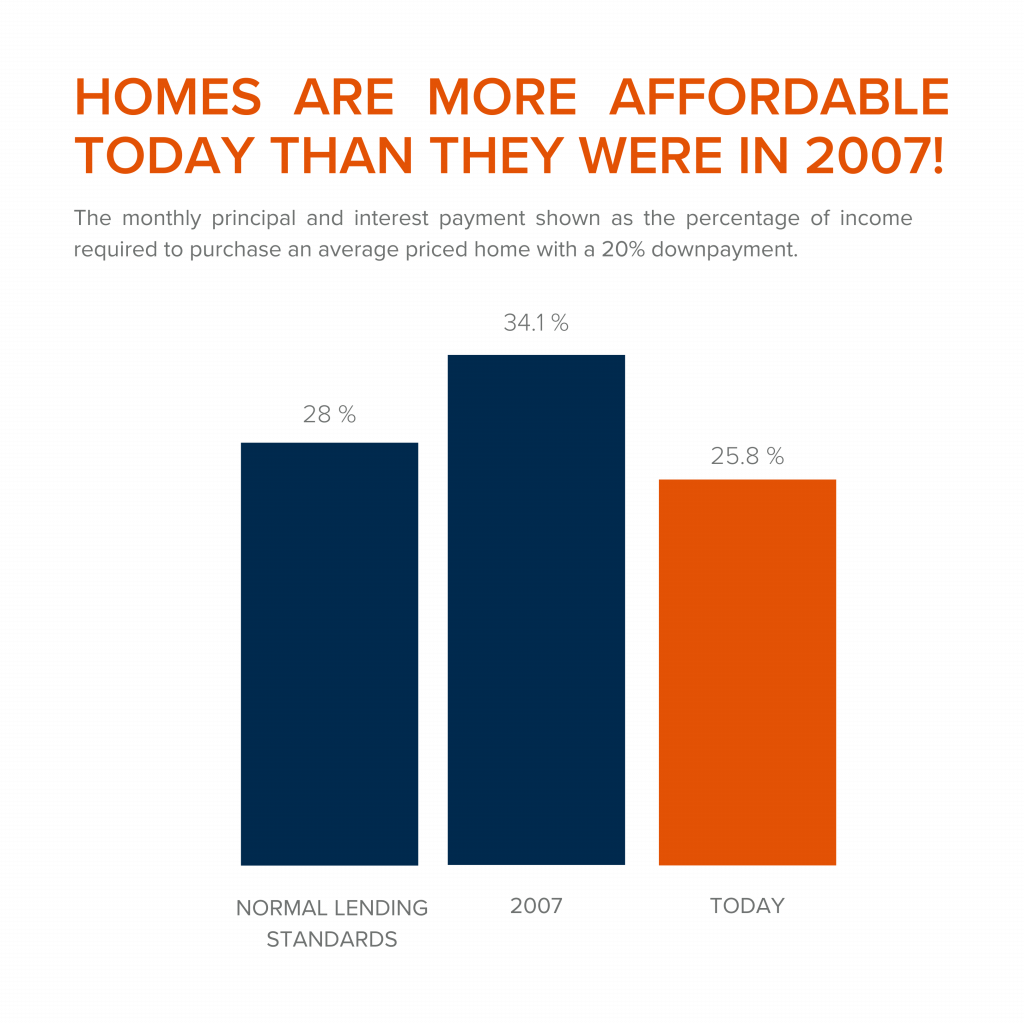
1. Houses Are Affordable Unlike During the Housing Boom
To understand this, one must understand the affordability formula. The affordability formula consists of three parts: the price of the home, wages earned by the purchaser, and the mortgage rate available at the time of purchase. Conventional lending standards suggest a purchaser should spend no more than 28% of their gross income on their mortgage payment.
Fifteen years ago, prices were high, wages were low, and mortgage rates were over 6%. While today's home prices are high, wages have increased significantly, and despite the latest spike, mortgage rates are still well below 6%. This means that todays average buyer spends less of their monthly income toward their mortgage payment than buyers did back then.
In the latest Affordability Report by ATTOM Data, Chief Product Officer Todd Teta speaks to this stating, "The average wage earner can still afford the typical home across the U.S., but the financial comfort zone continues shrinking as home prices keep soaring and mortgage rates tick upward."
Undeniably, affordability is not as strong as it was last year, but it is significantly better than it was during the boom. The graph below demonstrates that difference:
How did so many homes sell during the housing boom with such prohibitive costs?
2. Mortgage Standards Were Much More Relaxed During the Boom
Getting approved for a mortgage loan was significantly more attainable during the housing bubble than it is today. According to credit.org, a credit score between 550-619 is considered poor. They define those with a score below 620, by stating that, "Credit agencies consider consumers with credit delinquencies, account rejections, and little credit history as subprime borrowers due to their high credit risk."
While buyers can still qualify for a mortgage with a credit score within that range they are considered riskier borrowers. If you are in that range, read our How Long Does it Take to Save for a Down Payment article here. Below is a graph illustrating the mortgage volume issued to buyers with a credit score less than 620 during the housing boom, in compression to the following 14 years.
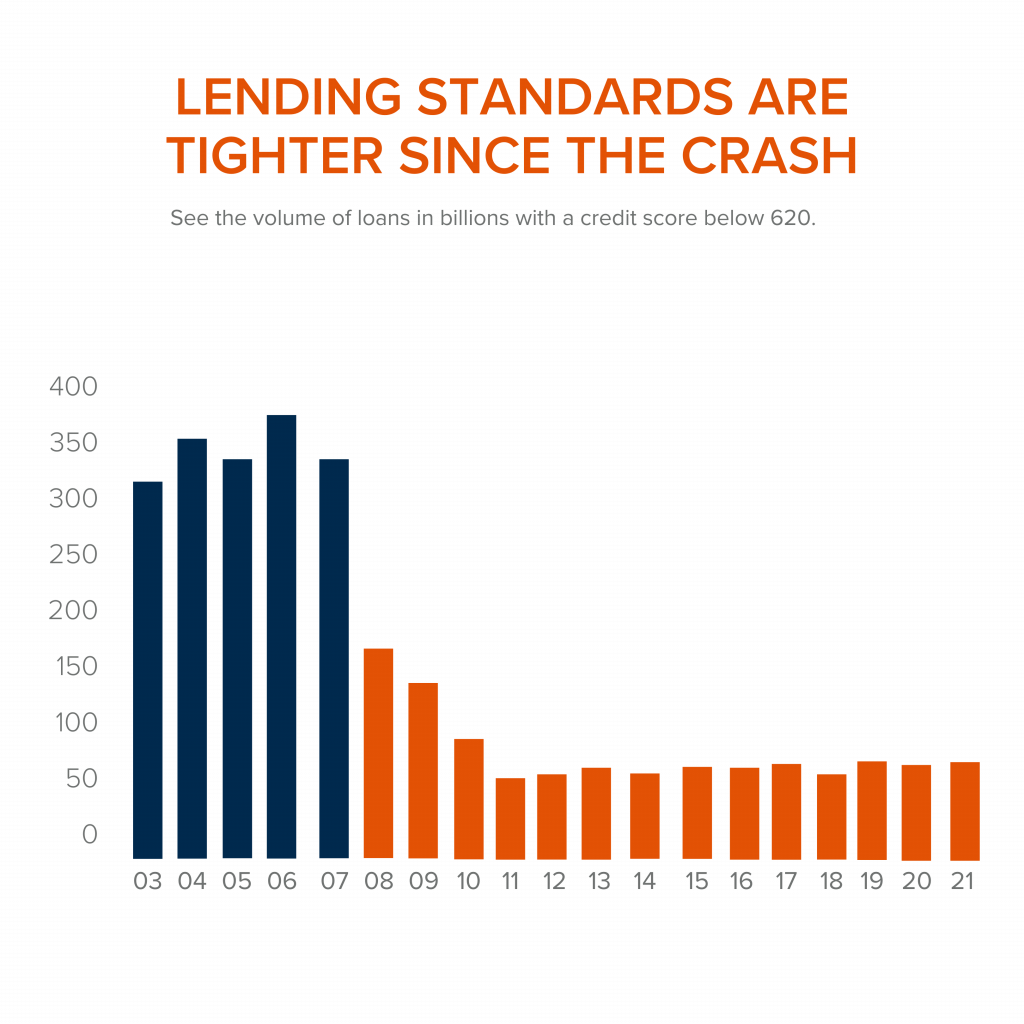
Mortgage standards are significantly different than they were last time. Buyers that obtained mortgages during the past decade are better qualified for the loans. Lets look at what that means moving forward.
3. Foreclosure Are Completely Different Than They Were During The Crash
The most obvious difference is the number of homeowners that were facing foreclosure after the housing bubble burst. The Federal Reserve issues a report showing the number of consumers with a new foreclosure notice. Here are the numbers during the crash compared to today:
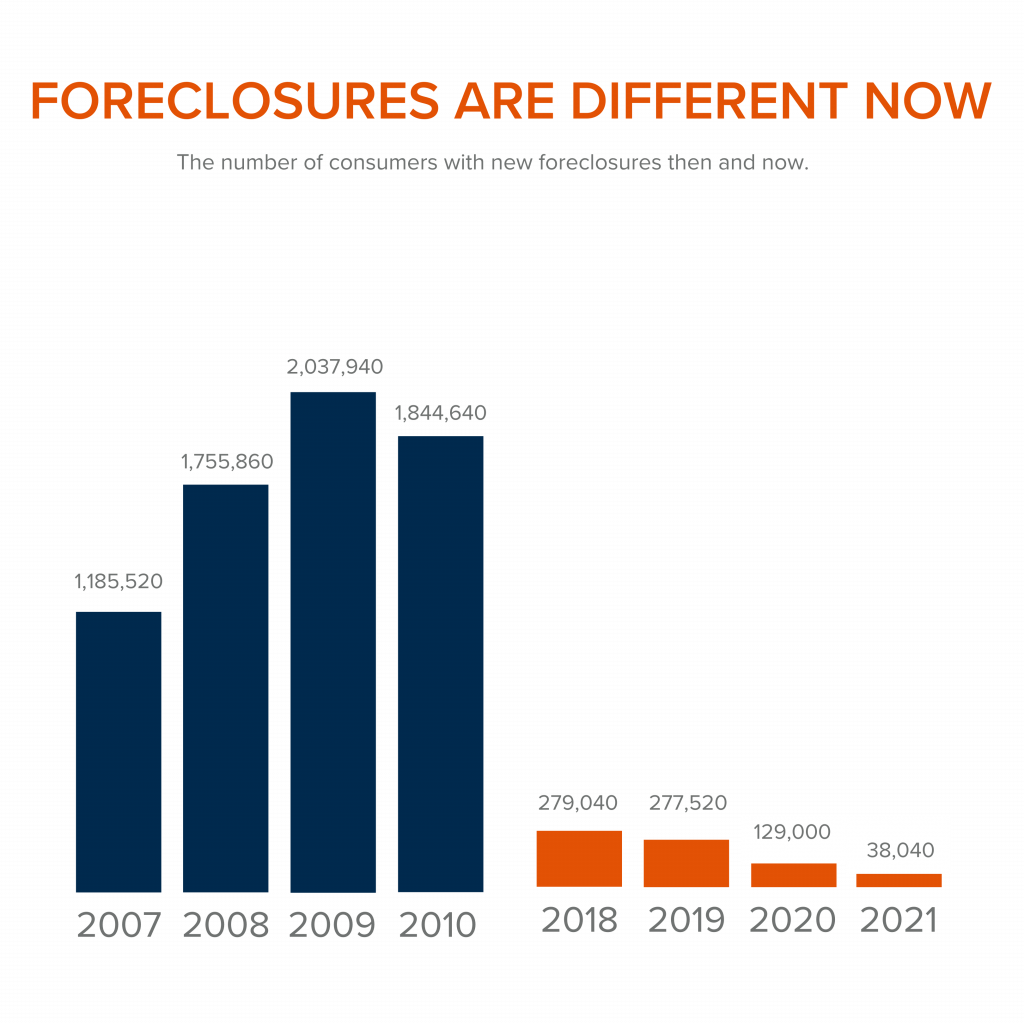
Undoubtedly the 2020 and 2021 numbers are impacted by the forbearance program, which was created to help homeowners facing uncertainty during the pandemic. Keep in mind, there are less than 800,000 homeowners remaining in the program today, and the majority of those will be able to work out a repayment plan with their banks.
Rick Sharga, Executive Vice President of RealtyTrac, explains, "The fact that foreclosure starts declined despite hundreds of thousands of borrowers exiting the CARES Act mortgage forbearance program over the last few months is very encouraging. It suggests that the ‘forbearance equals foreclosure' narrative was incorrect."
Why are there significantly less foreclosures seen today? Well, homeowners today are equity rich. They are not tapped out.
During the build-up to the housing bubble, some homeowners were using their homes as personal ATM machines. We saw a plethora of people withdrawing their equity the moment it was built up. When home values began to fall, many homeowners found themselves in a negative equity situation where the amount they owed on their mortgage had surpassed the value of their home. Many were faced with the decision of walking away from their homes. When that happened it led to a rash of distressed property listings (foreclosures and short sales), which sold at huge discounts, thus lowering the value of comparable homes in the area.
Homeowners, have since learned their lessons. Prices have risen nicely over the last few years, leading to over 40% of homes in the country having more than 50% equity. But owners have not been tapping into it like they had previously, as indicated by the fact that national tappable equity has increased to a record $9.9 trillion. With the average home equity now standing at $300,000. What happened last time will not happen today.
As the latest Homeowner Equity Insights report from CoreLogic explains, "Not only have equity gains helped homeowners more seamlessly transition out of forbearance and avoid a distressed sale, but they've also enabled many to continue building their wealth."
There will be nowhere near the same number of foreclosures as we seen during the crash. What does that mean for the housing market today?
4. There is Not a Surplus of Homes on the Market – We Have a Shortage
The supply of inventory needed to sustain a normal real estate market is approximately six months. Anything more than that is an overabundance and will causes prices to depreciate. Anything less than that is a shortage and will lead to continued price appreciation. The following graph demonstrates, the surplus of homes for sale between 2007 to 2010 (many of which were short sales and foreclosures). That caused prices to tumble. Today, there is a shortage of inventory, which is creating the increasing home values we are witnessing today.
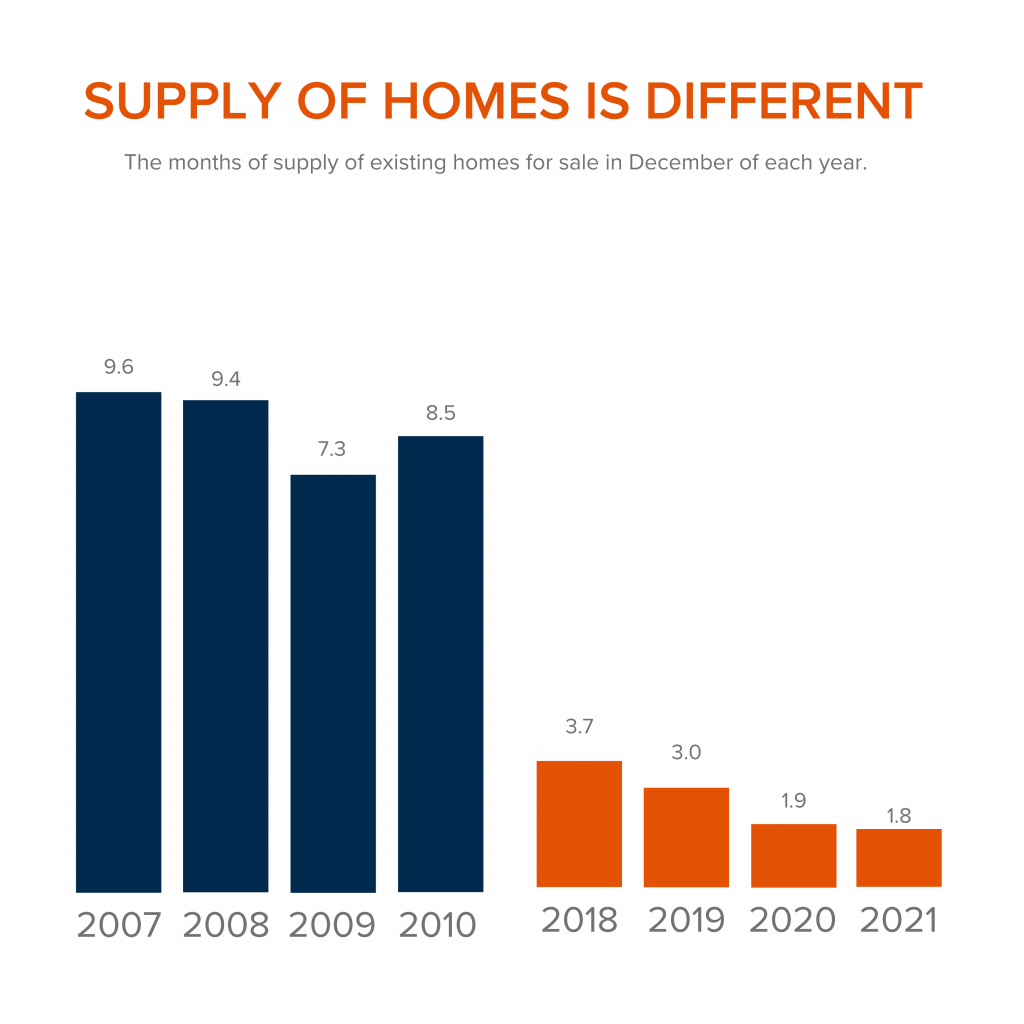
Inventory is drastically different in comparison to last time. Prices are rising because there is a healthy demand for homeownership while at the same time there is a shortage of homes for sale.
At the end of the day,
if you are worried that we are making the same mistakes that led to the housing crash, the graphs above show data and insights to help alleviate your concerns. If you are considering buying or selling and would like to dive deeper into this subject we would be happy to schedule a consult with you. Call us today at 360.675.5953.
Is the Oak Harbor Housing Market Getting Squishy?

Written by: Kristen Stavros
16 September 2021
There is a general feeling amongst brokers that the Oak Harbor market has softened up just a bit. As Branch Manager and Co-owner of Windermere Whidbey Island I pay close attention to what my brokers are seeing and feeling out there in the market. When I begin to sense a theme I go to the numbers to see if they are telling the same story.

I’ll be really curious to see how these numbers change when we can add September data to them but I’m seeing the teensiest sign that there may be some easing.
For the first time all year, we’ve seen a dip in closed sales in August.

At the same time, new listings continue to rise every month.
Average days on market has plateaued.
Does this mean buyers can start getting homes for less $$$?
The answer is emphatically, NO. As you can see from the graphs below prices continue to climb, inventory is still at a record low, and homes are still moving off the market incredibly fast. This just means that instead of being up against 10 other buyers you now may be up against just 2-3 other qualified buyers. Instead of great homes going for up to 10-20% over list price, the good ones may just end up 5-8% over list. The pressure on buyers is still decidedly strong but the dial has been turned down ever so slightly.
Average Price Per Square Foot.
Months’ Supply of Homes (based on closed sales).
Average Days on Market.
Sellers still have a fantastic advantage in this market but things are changing weekly so we are encouraging sellers to not get too greedy or assured because doing so may mean you overprice the market, lose the opportunity to garner multiple offers out of the gate, and ultimately make less profit on your home.
Working with a smart and sophisticated listing agent has never been more important in the previous 3 years than it is RIGHT NOW. You need someone who is really going to take their time analyzing the market against your specific home before giving you pricing advice. Call us today to be connected with a market pricing expert!
This analysis focuses just on the Oak Harbor market but we have the same analysis going on for all of Whidbey Island! If you are interested in knowing more about any aspect of Whidbey Island real estate let us know and we are happy to share.
5 Most Affordable Neighborhoods Near Oak Harbor & NAS Whidbey
Watching today’s housing market is like reliving a supply and demand lesson straight out of your High School Macroeconomics class. Home prices continue to rise due to the sheer lack of homes for sale on Whidbey Island. Especially in the lower price points $400,000 and below.
Here are 5 of the most affordable neighborhoods within 10 miles of downtown Oak Harbor and NAS Whidbey.
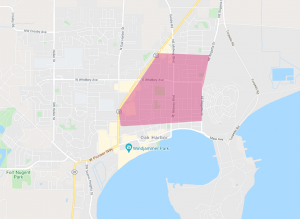
#1 City of Oak Harbor:
Median Price Point as of this post = $318,000 (15.6% increase from last year). Because Oak Harbor has been developed over the decades by various builders at different rates there are a lot of little neighborhoods. The most affordable area can be found in the middle of the City, on the East side between Highway 20 and SE Regatta Dr. Most homes in this area are from the 1950s in developments like Patton’s Pasture & Shady Oaks.
Design by Windermere Whidbey Island
#2 Rolling Hills:
Median Price Point as of this post = $338,500 (16.9% increase from last year). Located between Oak Harbor and Coupeville Rolling Hills was incorporated in 1961 but you will find a broad range of homes built across the decades. There are many manufactured homes, a few mobile homes and lots of stick built. One of the unique features of this community for Whidbey Island is their Community facilities which includes a pool, clubhouse, basketball court, baseball field, picnic shelter, and even some waterfront with a private pier. Water is managed by the community. All the homes are on septic systems, some with a community drain field.
Want to learn more about Rolling Hills? Click here.
Median Sales Price for Rolling Hills by Windermere Whidbey Island
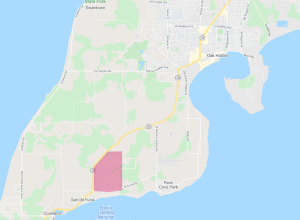
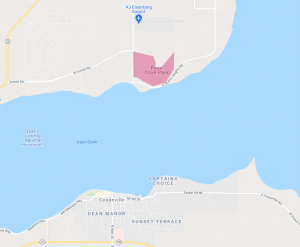
#3 Penn Cove Park:
Median Price Point as of this post = $348,500 (12.2% increase from last year). Although Penn Cove Park now connects to Cove View Circle, has several water view homes, and has a new construction project going on nearby we are going to focus on the original homes built for this neighborhood that don’t have water views, because this is the more affordable area. Homes were built mostly between 1950-1980, all are 1-story. All are connected to a very rare, combined sewage treatment plant (not on septic) managed by Penn Cove Water & Sewer. This best part of this neighborhood is the location. One of the most enjoyable beaches with a low slope and sandy areas and public boat launches is right at the end of Monroe Landing. You can look across Penn Cove and enjoy views of the seaside Town of Coupeville and its iconic wharf. Conveniently located between Oak Harbor and Coupeville you have access to two very different types of commerce and can petition to be in either school district.
Median Sales Price for Penn Cove by Windermere Whidbey Island
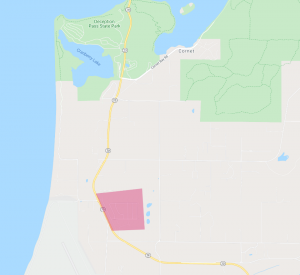
#4 Northgate Terrace:
Median Price Point as of this post = $295,000 (15.8% increase from last year). Most of this community was first developed in the late 70’s. It is a mix of manufactured and smaller stick-built homes. There is a homeowner’s association, water is managed as a community by King water and there is a community clubhouse you can rent for gatherings. It is conveniently located right off of Highway 20 between the City of Oak Harbor and Deception Pass Bridge. More information can be found on their community web site here.
Median Sales Price for Northgate Terrace by Windermere Whidbey Island
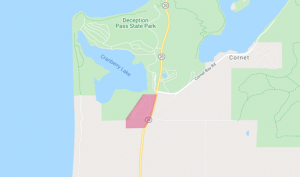
#5 Deception Park View:
It may be a tiny little neighborhood but it’s a delight and as you can see from their website they really care about their little community. It has a very active Homeowners Association. You can learn all about their recent efforts to create a Community Recreation Area in the neighborhood on their website here.
Median Sales Price for Deception Park by Windermere Whidbey Island