 Facebook
 X
X
 Pinterest
 Copy Link


When Rents Rise, You Pay More But You Don’t Get More
When rents rise, you pay more but you don’t get more.
Interest rates might be rising, but so is rent! As Nadia Evangelou, Senior Economist and Director of Forecasting at the National Association of Realtors (NAR), says:
“There is no doubt that these higher rates hurt housing affordability. Nevertheless, apart from borrowing costs, rents additionally rose at their highest pace in nearly four decades.” So, which is right for you? Buying a house or renting? If you are finding yourself in a place where you are struggling to determine which is the right decision here’s some food for thought.
RENT CONTINUES TO RISE
Rent has continually risen significantly for decades with no end in sight. It is no coincidence that as costs rise rents do too. In fact, 72% of landlords intend on raising the rent on at least one of their properties within the next year. Could that be you? Have you ever stopped to think that when rents rise, you pay more, but you don’t get more? Not only can you make money in the long run by buying a home but buying a home can prevent you from getting trapped in the cycle of continually rising rent.
When you become a homeowner, you have the opportunity to lock in your monthly payment for 15 to 30 years without it increasing as rent does. Be sure to discuss the advantages of the different types of loan options you qualify for with your Mortgage Lender (don’t have one? You can find one here). This is where homeownership pays off. Not only does your monthly payment remain low as rents around you increase creating a shield of protection from inflation but you also gain equity as your home value increases, and your loan amount decreases with each additional payment producing significantly more equity in your home each month.
ON THE FLIP SIDE
On the flip side, you need to consider the maintenance and upkeep costs of owning your own home. There is no calling the landlord when things break down or wear out and depending on the age and condition of the home you could be looking at paying a big lump sum in the future. Beyond cosmetics maintenance, you will also need to consider the cost of replacing things like your hot water heater, furnace, or even the roof over time.
Homeownership is not the right decision for everyone but consulting with an experienced Windermere broker to help weigh through all the considerations is something we love to help with, and it doesn’t cost you anything. In the meantime check out this article to dig deeper into whether or not buying or renting is better for you. Don’t have your own Windermere agent yet? Connect with us here.

We are NOT in a Housing Bubble: Here’s Why!
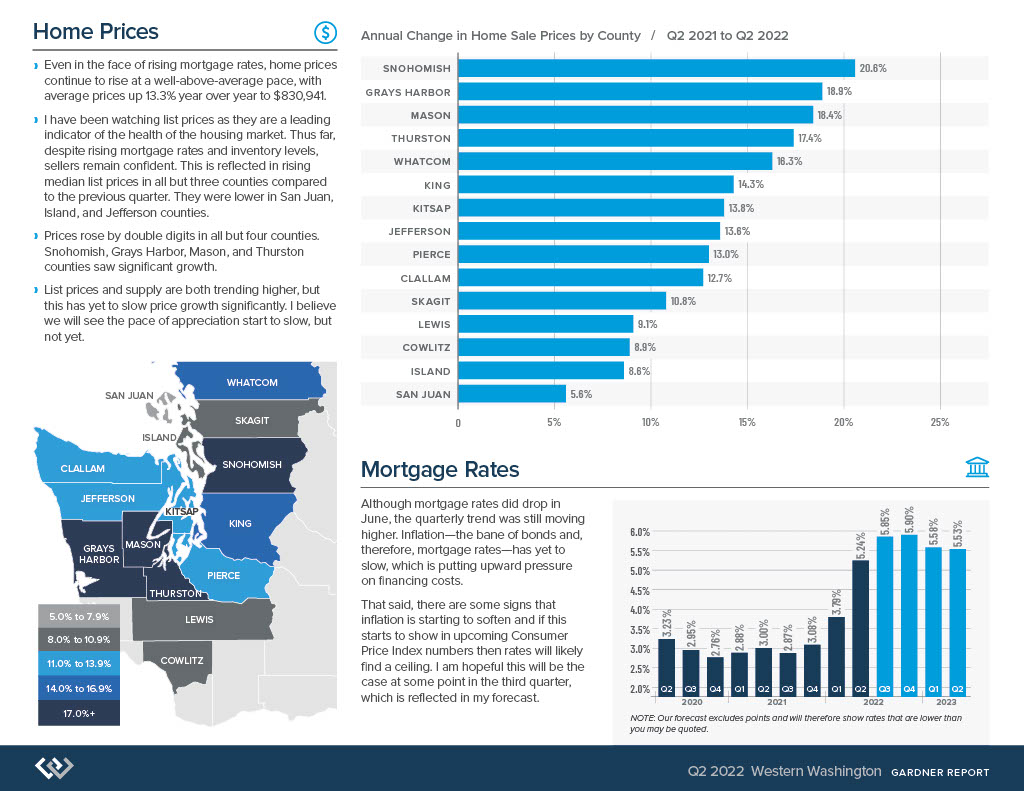
Home buyers are beginning to believe we are heading into a housing bubble. It is easy to acknowledge this premonition, as year-after-year home price appreciation has continued to remain in the double digits.
However, we are here to put your mind at ease as this market is very different than it was during the housing crash 15 years ago. Follow along as we explain four fundamental reasons why today's market is nothing like the market was back then.
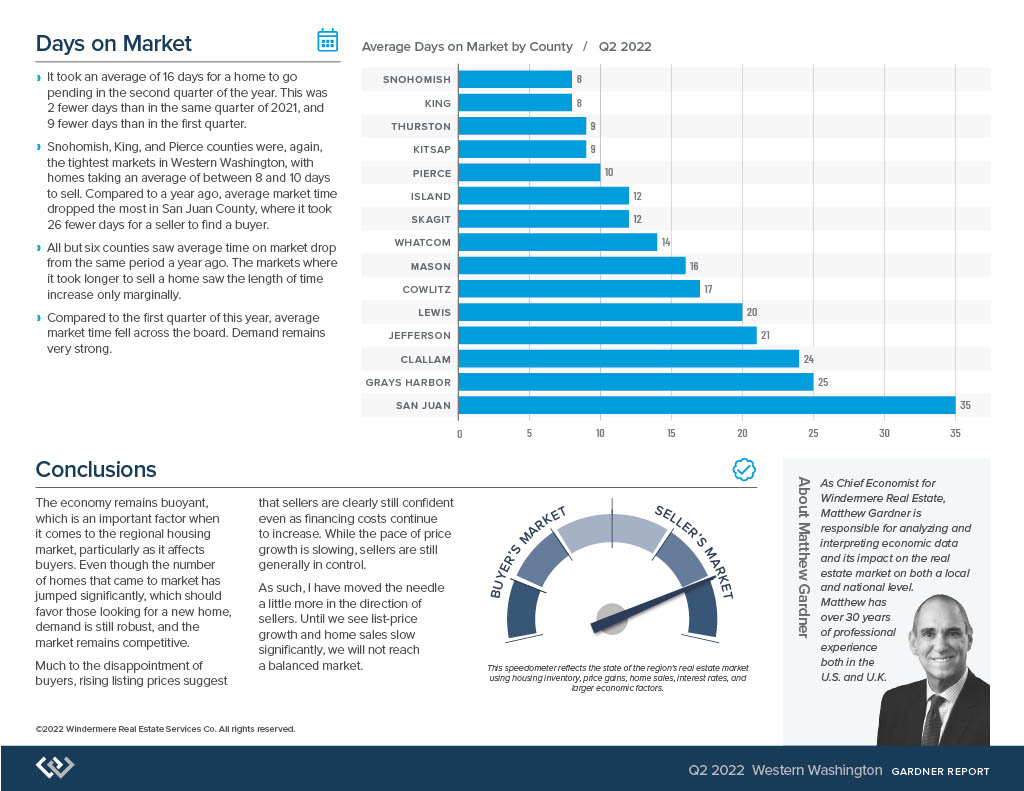
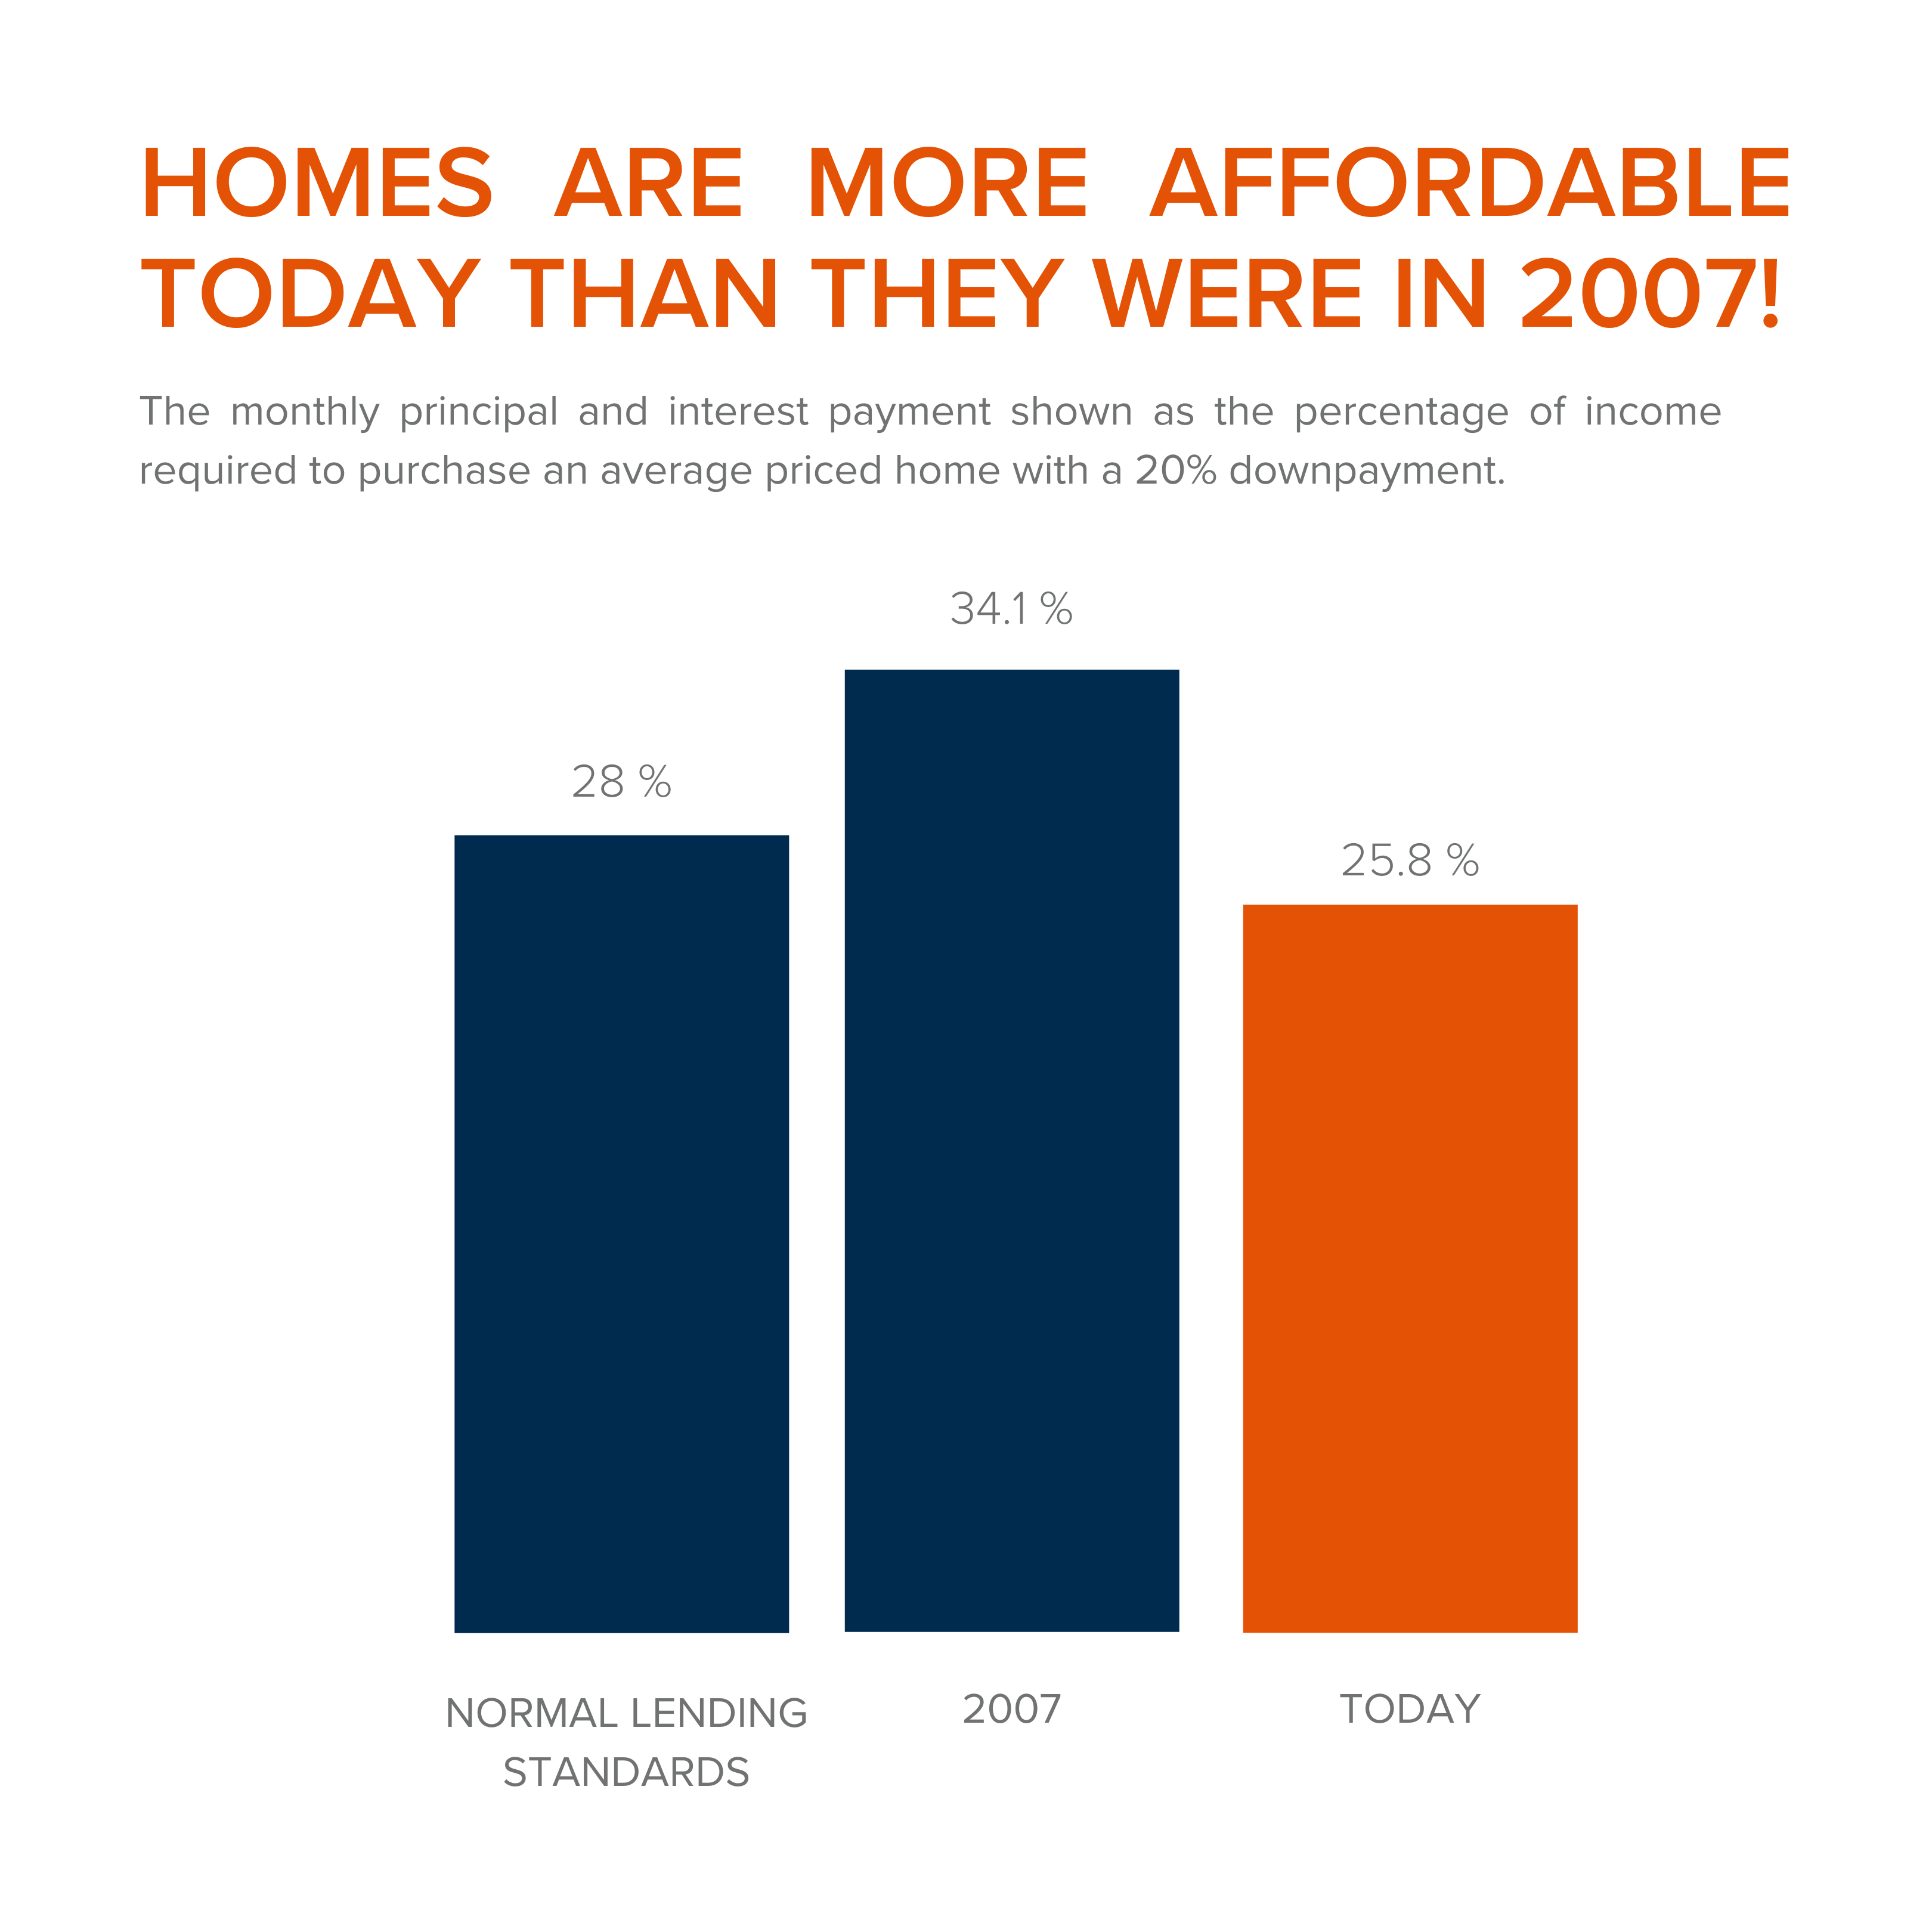
1. Houses Are Affordable Unlike During the Housing Boom
To understand this, one must understand the affordability formula. The affordability formula consists of three parts: the price of the home, wages earned by the purchaser, and the mortgage rate available at the time of purchase. Conventional lending standards suggest a purchaser should spend no more than 28% of their gross income on their mortgage payment.
Fifteen years ago, prices were high, wages were low, and mortgage rates were over 6%. While today's home prices are high, wages have increased significantly, and despite the latest spike, mortgage rates are still well below 6%. This means that todays average buyer spends less of their monthly income toward their mortgage payment than buyers did back then.
In the latest Affordability Report by ATTOM Data, Chief Product Officer Todd Teta speaks to this stating, "The average wage earner can still afford the typical home across the U.S., but the financial comfort zone continues shrinking as home prices keep soaring and mortgage rates tick upward."
Undeniably, affordability is not as strong as it was last year, but it is significantly better than it was during the boom. The graph below demonstrates that difference:
How did so many homes sell during the housing boom with such prohibitive costs?
2. Mortgage Standards Were Much More Relaxed During the Boom
Getting approved for a mortgage loan was significantly more attainable during the housing bubble than it is today. According to credit.org, a credit score between 550-619 is considered poor. They define those with a score below 620, by stating that, "Credit agencies consider consumers with credit delinquencies, account rejections, and little credit history as subprime borrowers due to their high credit risk."
While buyers can still qualify for a mortgage with a credit score within that range they are considered riskier borrowers. If you are in that range, read our How Long Does it Take to Save for a Down Payment article here. Below is a graph illustrating the mortgage volume issued to buyers with a credit score less than 620 during the housing boom, in compression to the following 14 years.
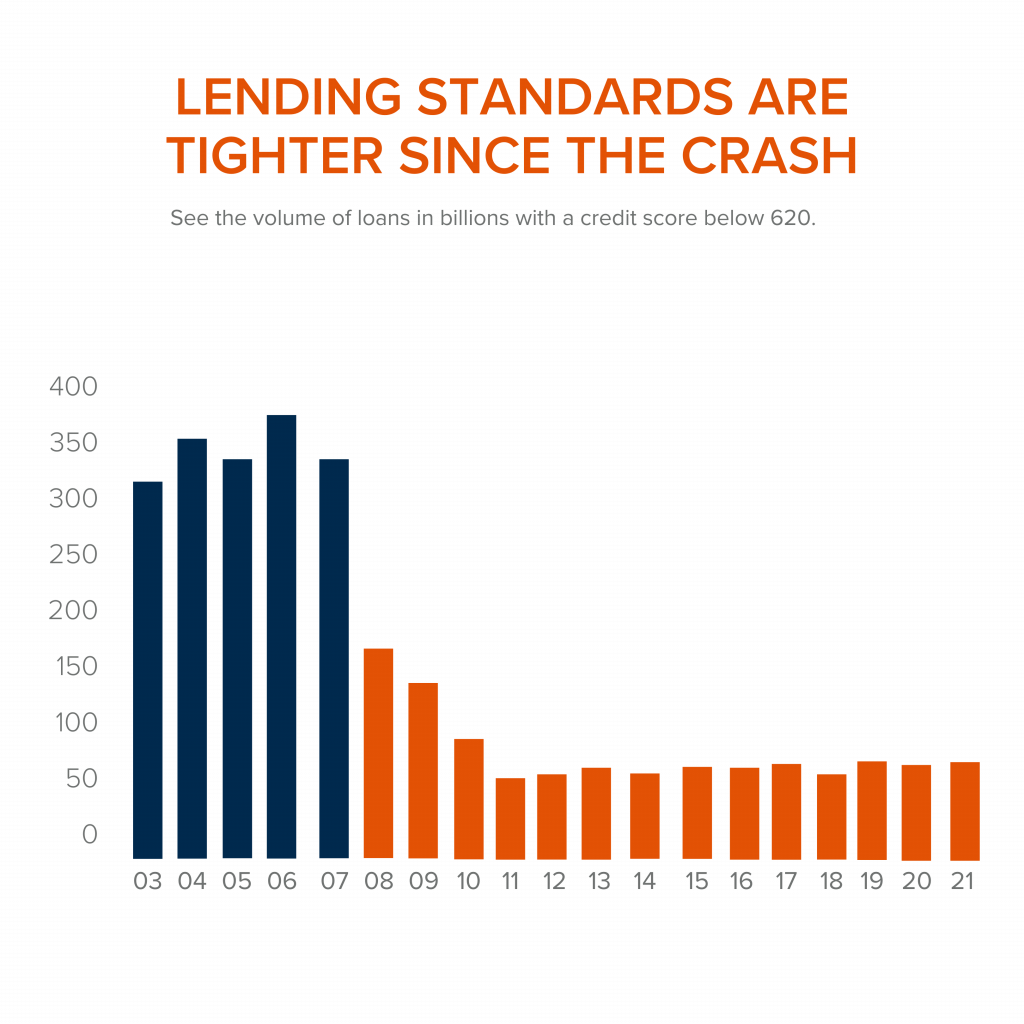
Mortgage standards are significantly different than they were last time. Buyers that obtained mortgages during the past decade are better qualified for the loans. Lets look at what that means moving forward.
3. Foreclosure Are Completely Different Than They Were During The Crash
The most obvious difference is the number of homeowners that were facing foreclosure after the housing bubble burst. The Federal Reserve issues a report showing the number of consumers with a new foreclosure notice. Here are the numbers during the crash compared to today:
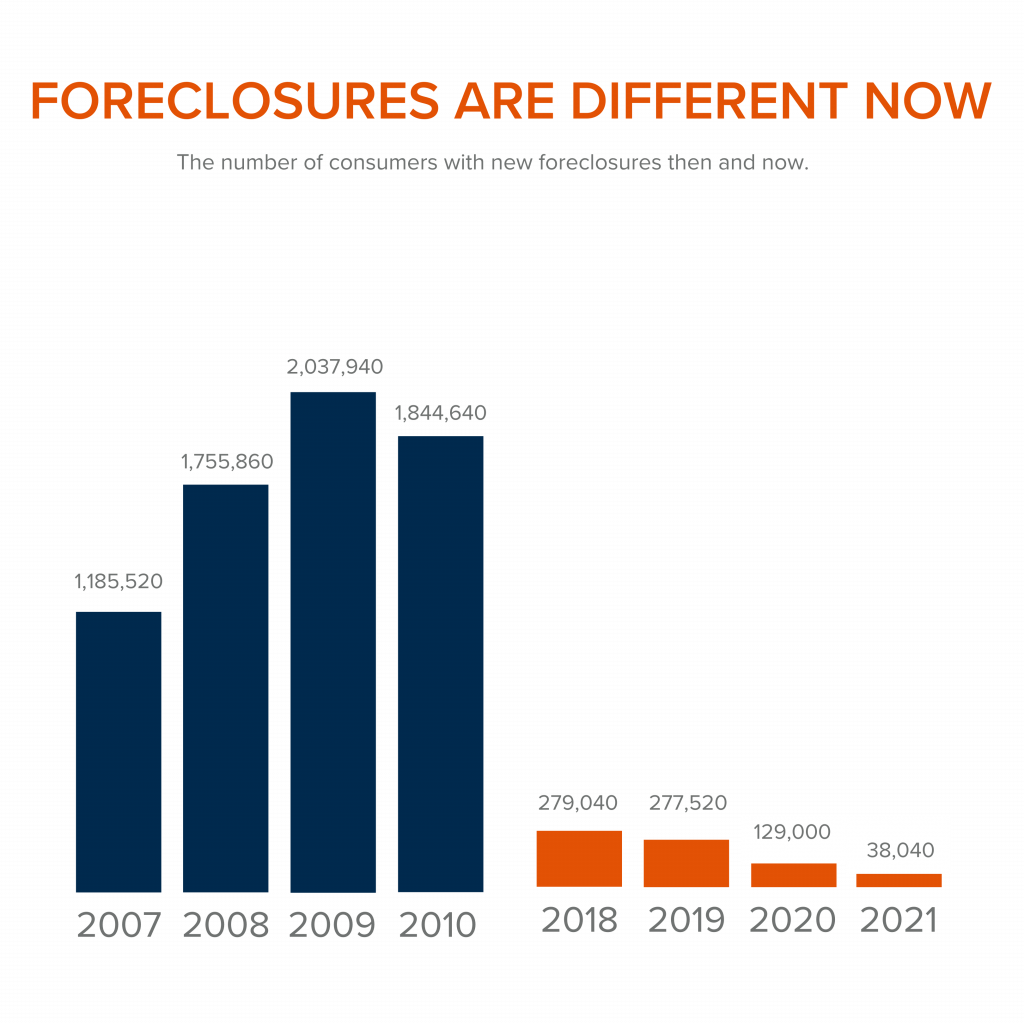
Undoubtedly the 2020 and 2021 numbers are impacted by the forbearance program, which was created to help homeowners facing uncertainty during the pandemic. Keep in mind, there are less than 800,000 homeowners remaining in the program today, and the majority of those will be able to work out a repayment plan with their banks.
Rick Sharga, Executive Vice President of RealtyTrac, explains, "The fact that foreclosure starts declined despite hundreds of thousands of borrowers exiting the CARES Act mortgage forbearance program over the last few months is very encouraging. It suggests that the ‘forbearance equals foreclosure' narrative was incorrect."
Why are there significantly less foreclosures seen today? Well, homeowners today are equity rich. They are not tapped out.
During the build-up to the housing bubble, some homeowners were using their homes as personal ATM machines. We saw a plethora of people withdrawing their equity the moment it was built up. When home values began to fall, many homeowners found themselves in a negative equity situation where the amount they owed on their mortgage had surpassed the value of their home. Many were faced with the decision of walking away from their homes. When that happened it led to a rash of distressed property listings (foreclosures and short sales), which sold at huge discounts, thus lowering the value of comparable homes in the area.
Homeowners, have since learned their lessons. Prices have risen nicely over the last few years, leading to over 40% of homes in the country having more than 50% equity. But owners have not been tapping into it like they had previously, as indicated by the fact that national tappable equity has increased to a record $9.9 trillion. With the average home equity now standing at $300,000. What happened last time will not happen today.
As the latest Homeowner Equity Insights report from CoreLogic explains, "Not only have equity gains helped homeowners more seamlessly transition out of forbearance and avoid a distressed sale, but they've also enabled many to continue building their wealth."
There will be nowhere near the same number of foreclosures as we seen during the crash. What does that mean for the housing market today?
4. There is Not a Surplus of Homes on the Market – We Have a Shortage
The supply of inventory needed to sustain a normal real estate market is approximately six months. Anything more than that is an overabundance and will causes prices to depreciate. Anything less than that is a shortage and will lead to continued price appreciation. The following graph demonstrates, the surplus of homes for sale between 2007 to 2010 (many of which were short sales and foreclosures). That caused prices to tumble. Today, there is a shortage of inventory, which is creating the increasing home values we are witnessing today.
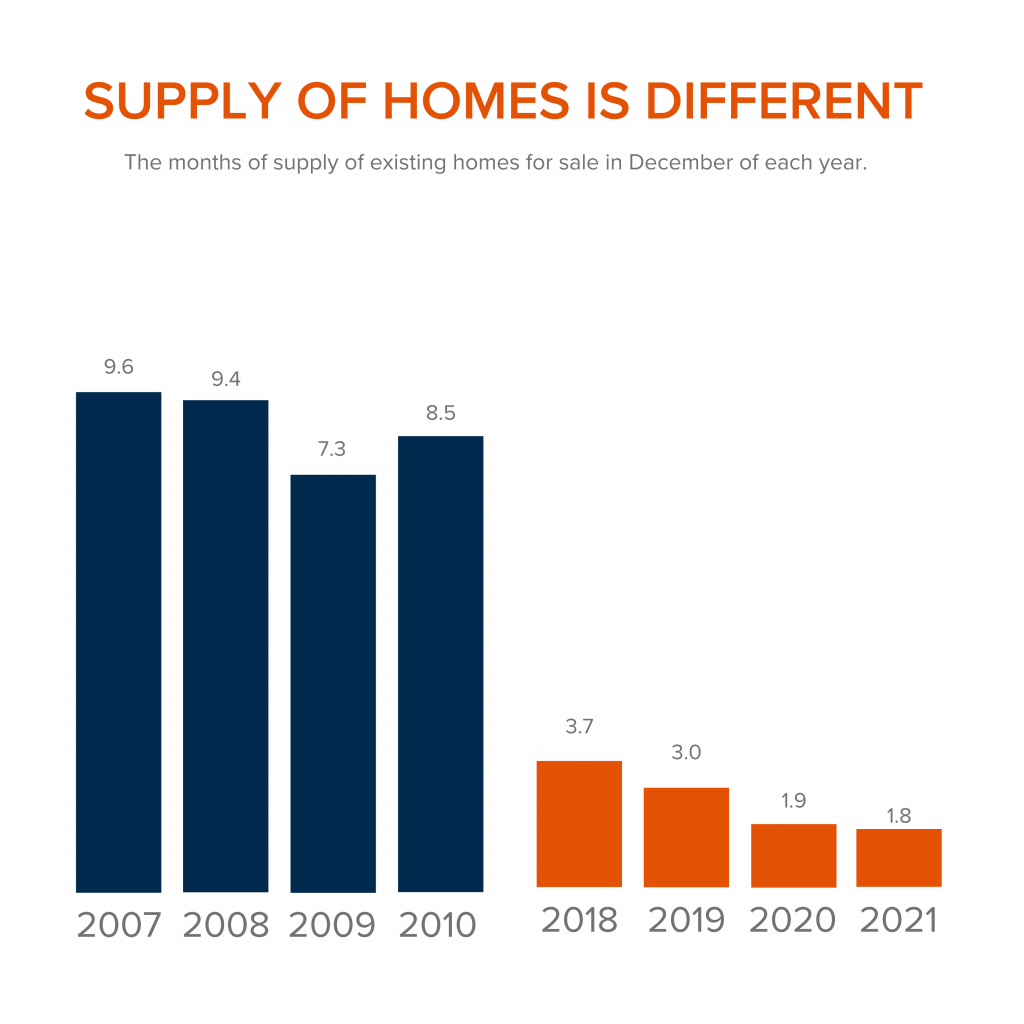
Inventory is drastically different in comparison to last time. Prices are rising because there is a healthy demand for homeownership while at the same time there is a shortage of homes for sale.
At the end of the day,
if you are worried that we are making the same mistakes that led to the housing crash, the graphs above show data and insights to help alleviate your concerns. If you are considering buying or selling and would like to dive deeper into this subject we would be happy to schedule a consult with you. Call us today at 360.675.5953.
Thinking the Housing Market is Going to Slow down this Winter? Think Again!

Last week’s article, Why You Should NOT Wait to List Your House Right Now couldn’t have been more TRUE! Americans have more motivation than ever to buy a home. Whether buyers are taking advantage of today’s low mortgage rates or they feel the increased need for flexibility of working from home, we have seen an influx of buyers that just doesn’t seem to be slowing down any time soon. Experts reveal that buyers are making their moves right now, generating an unseasonably robust housing market compared to the historical past for this time of year.
As the fall season comes to an end we typically experience a decrease in demand…
…however, today as we move into the winter months we are witnessing quite the opposite. Industry leaders are boasting the strong market saying things like, “The demand for housing in the United States has reached a fever pitch, a trend that opposes the norm of this time of the year when the market cools as the winter months set in.” says the M Report, and Mark Fleming, the Chief Economist for First American who says, “Strong demographic demand will continue to act as the wind in the housing market’s sails.” But it doesn’t stop there, the highly esteemed Chief Economist for the National Association of Realtors (NAR) Lawrence Yun explains, “This solid buying is a testament to demand still being relatively high, as it is occurring during a time when inventory is still markedly low. The notable gain in October assures that total existing-home sale in 2021 will exceed 6 million, which will shape up to the best performance in 15 years.” Some might ask, What about November? First American Deputy Chief Economist Odeta Kushi stated, “So far in November, purchase applications point to another strong month in sales. Still, low rates and demographic demand supports this strength, even as affordability and inventory headwinds remain.”
How does this impact the housing market for Winter?
Buyers are active in the market and are competing for homes to purchase. With the momentum that is coming out of the fall, there is every indication that leads experts to believe that the winter housing market is picking up steam, making for a much busier season than the typical year. As we have seen in a plethora of ways, 2020 and 2021 were anything but typical for real estate, and from the looks of it, 2022 will quickly be added to that list.
At the end of the day…
… if you have been considering selling there’s no time like the present. Whether you are thinking about buying a home or selling your house, maybe even both – let’s connect to determine if this winter is your best time to make your move. Email us or call us today!
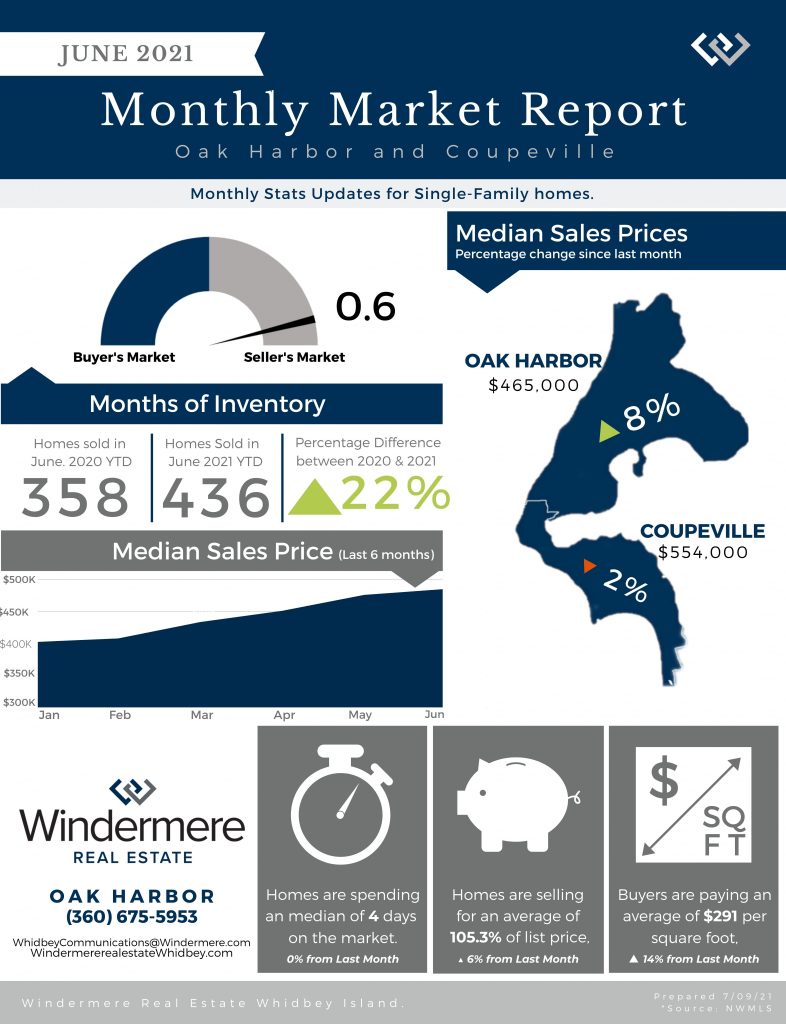
Q3, 2021 Quarterly Stats

Q3, 2021 – Quarterly Stats by Windermere Whidbey Island
Where Have All the Houses Gone?
In today’s housing market, it seems harder than ever to find a home to buy. Before the health crisis hit us a year ago, there was already a shortage of homes for sale. When many homeowners delayed their plans to sell at the same time that more buyers aimed to take advantage of record-low mortgage rates and purchase a home, housing inventory dropped even further. Experts consider this to be the biggest challenge facing an otherwise hot market while buyers continue to compete for homes. As Danielle Hale, Chief Economist at realtor.com, explains:
“With buyers active in the market and seller participation lagging, homes are selling quickly and the total number available for sale at any point in time continues to drop lower. In January as a whole, the number of for-sale homes dropped below 600,000.”
You can take a closer look at how the market here on Whidbey has progressed by clicking here.
Every month, realtor.com releases new data showing the year-over-year change in inventory of existing homes for sale. As you can see in the map below, nationwide, inventory is 42.6% lower than it was at this time last year:
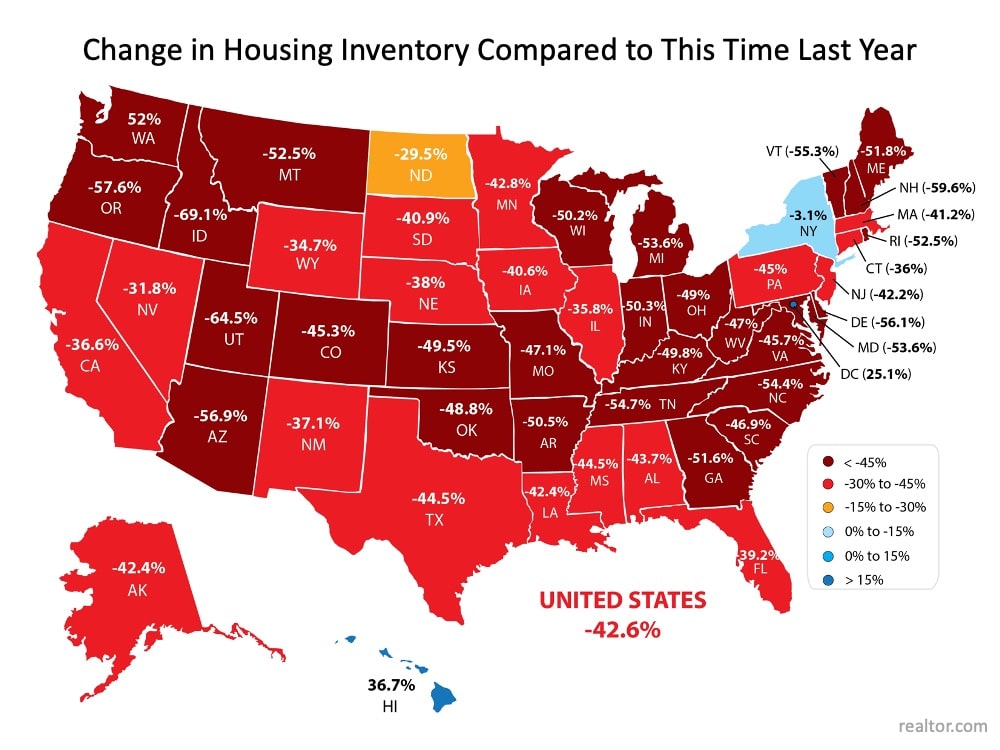
Does this mean houses aren’t being put on the market for sale?
Not exactly. While there are fewer existing homes being listed right now, many homes are simply selling faster than they’re being counted as current inventory. The market is that competitive! It’s like when everyone was trying to find toilet paper to buy last spring and it was flying off the shelves faster than it could be stocked in the stores. That’s what’s happening in the housing market: homes are being listed for sale, but not at a rate that can keep up with heavy demand from competitive buyers.
In the same realtor.com report, Hale explains:
“Time on the market was 10 days faster than last year meaning that buyers still have to make decisions quickly in order to be successful. Today’s buyers have many tools to help them do that, including the ability to be notified as soon as homes meeting their search criteria hit the market. By tailoring search and notifications to the homes that are a solid match, buyers can act quickly and compete successfully in this faster-paced housing market.”
The Good News for Homeowners
The health crisis has been a major reason why potential sellers have held off this long, but as vaccines become more widely available, homeowners will start making their moves. Ali Wolf, Chief Economist at Zonda, confirms:
“Some people will feel comfortable listing their home during the first half of 2021. Others will want to wait until the vaccines are widely distributed.”
With more homeowners getting ready to sell later this year, putting your house on the market sooner rather than later is the best way to make sure your listing shines brighter than the rest.
When you’re ready to sell your house, you’ll likely want it to sell as quickly as possible, for the best price, and with little to no hassle. If you’re looking for these selling conditions, you’ll find them in today’s market. When demand is high and inventory is low, sellers have the ability to create optimal terms and timelines for the sale, making now an exceptional time to move.
Bottom Line
Today’s housing market is a big win for sellers, but these conditions won’t last forever. If you’re in a position to sell your house now, you may not want to wait for your neighbors to do the same. Let’s connect to discuss how to sell your house safely so you’re able to benefit from today’s high demand and low inventory.
Continue to follow our local market with Windermere’s Cheif Economist, Matthew Gardner by clicking here.
Q1 2021 – Quarterly Report Stats

Q1, 2021- Quarterly Stats by Windermere Whidbey Island
You Might Also Like:

2020 Annual Market Report
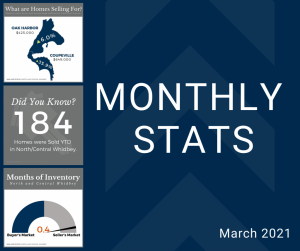
Monthly Stats: March 2021
